

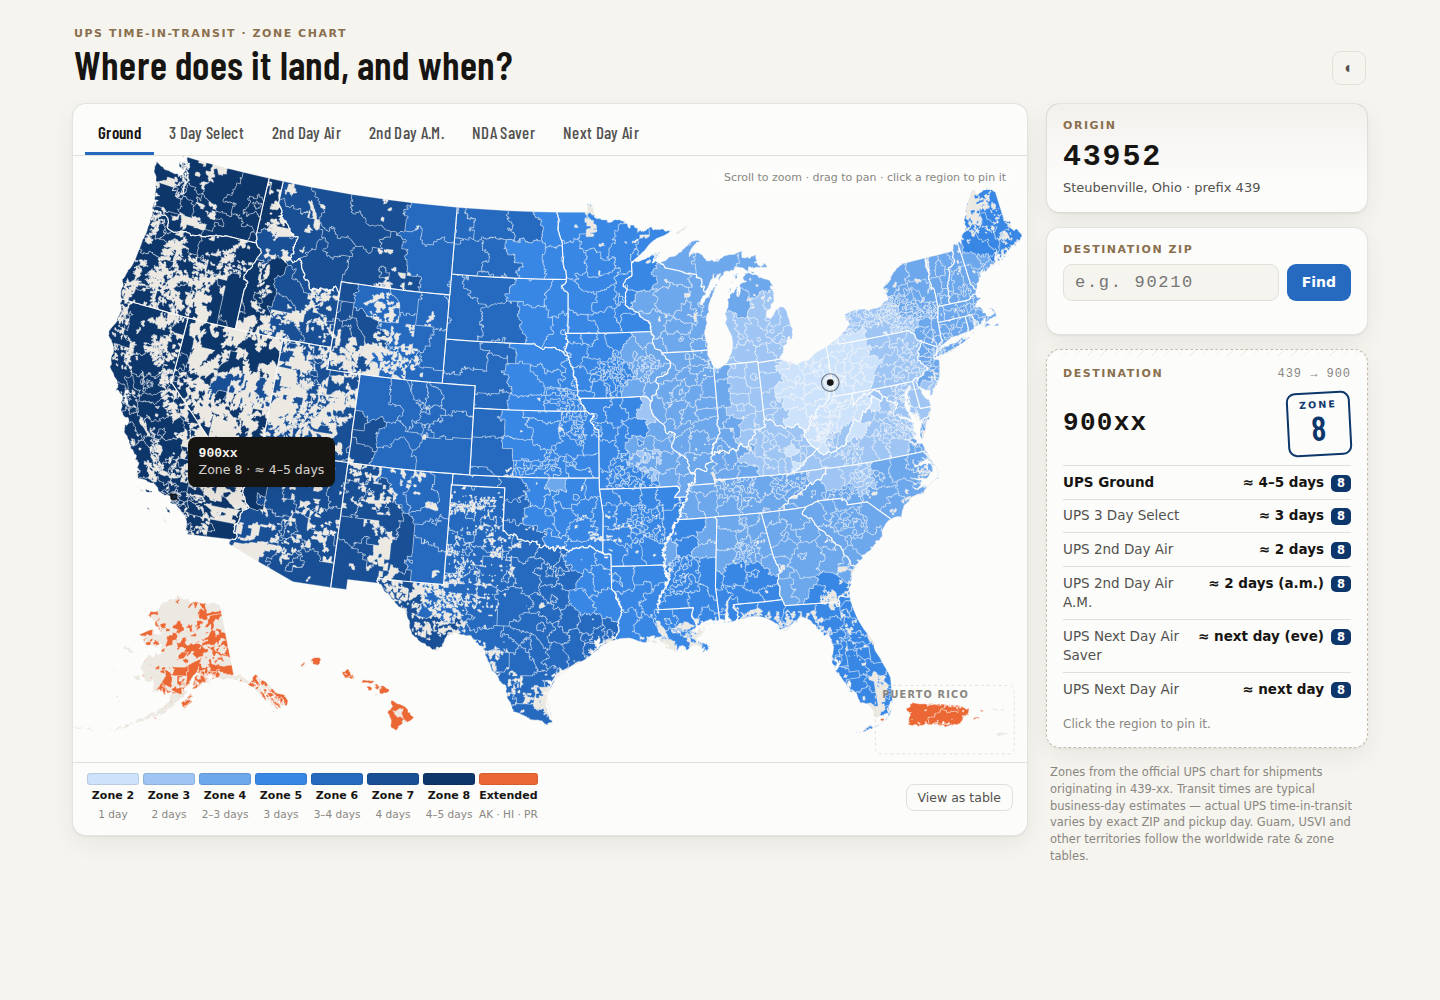
ZoneChart turns UPS's per-origin zone chart spreadsheets into an interactive US map: pick any origin ZIP, and every 3-digit destination prefix is colored by zone — light means close and fast, dark means far and slow — with typical time-in-transit for all six UPS services. One Flask container, no database, no external requests at runtime.
Features
- Interactive choropleth of all US 3-digit ZIP prefixes (with AK/HI and Puerto Rico insets) — hover for zone + transit estimate, click to pin, scroll to zoom
- All six UPS services — Ground, 3 Day Select, 2nd Day Air, 2nd Day Air A.M., Next Day Air Saver, Next Day Air
- Waybill panel — a live shipping-label card showing every service's zone and estimate for any destination; 5-digit AK/HI ZIPs resolve their exact extended zones
- Any origin — the complete UPS dataset (~894 origin charts) downloads from ups.com via the built-in admin dashboard; switch origins instantly
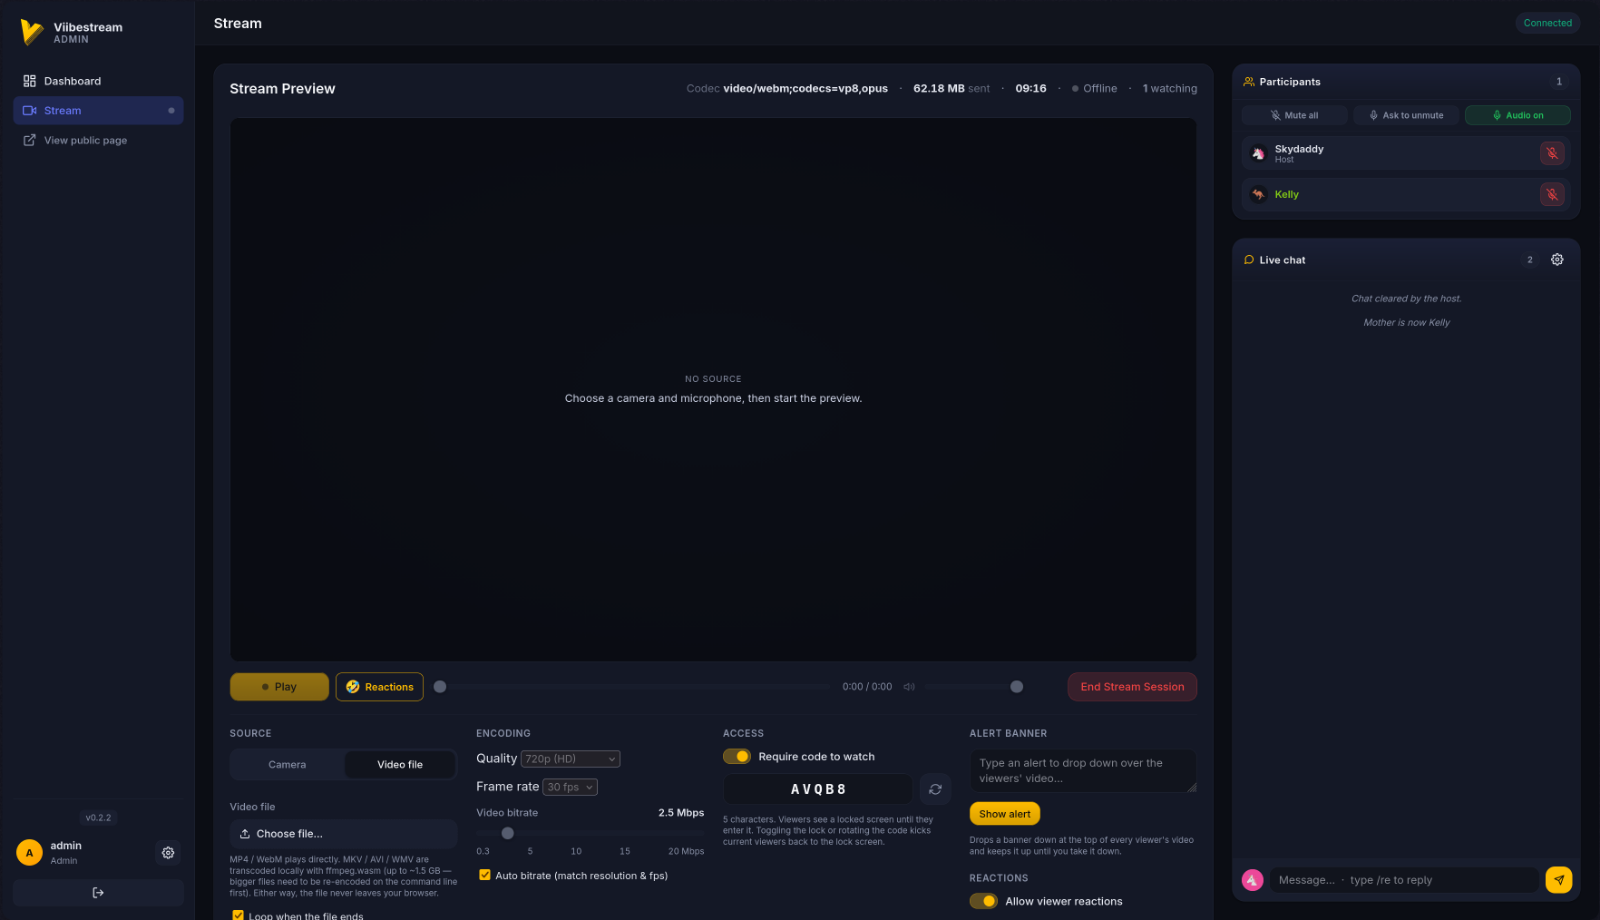
- Admin dashboard — password-protected, with one-click dataset refresh, a live per-prefix progress grid, optional Cloudflare Turnstile, and an origin lock for single-warehouse setups
- Dark mode, mobile layout, full table view for accessibility
Requirements
Docker and Docker Compose. Idle, it's a small Flask process; during a dataset refresh it runs a headless Chromium, so allow ~500MB of headroom.
Install with Docker Compose
No clone needed — the image is on Docker Hub. Save this as docker-compose.yml in an empty directory:
services:
  zonechart:
    image: hyprlab/zonechart:latest
    container_name: zonechart
    ports:
      # host:container — change 8093 if that port is taken; the app always
      # listens on 8000 inside the container
      - "8093:8000"
    volumes:
      # persists downloaded zone charts and refresh state on the host, so
      # the ~45-minute dataset download happens only once
      - ./data:/data
    environment:
      # REQUIRED — protects the /admin dashboard (dataset downloads).
      # Set it in .env; compose refuses to start if it is missing.
      ADMIN_PASSWORD: ${ADMIN_PASSWORD:?set ADMIN_PASSWORD in .env}
      # Optional — origin ZIP prefix shown when the page first loads.
      # Any 3-digit prefix you have a chart for (default: 439).
      DEFAULT_ORIGIN: ${DEFAULT_ORIGIN:-439}
    restart: unless-stopped
    healthcheck:
      test: ["CMD", "python", "-c", "import urllib.request; urllib.request.urlopen('http://localhost:8000/healthz')"]
      interval: 30s
      timeout: 5s
      retries: 3
Start it and open http://localhost:8093 — the map renders immediately with the bundled sample origin (439, eastern Ohio):
docker compose up -d
Then click Admin (top right), sign in with your ADMIN_PASSWORD, and hit Refresh charts. ZoneChart downloads the official chart for every US origin prefix from ups.com — about 45 minutes, rate-limited, with live progress, and resumable if interrupted. Charts live in ./data/ on the host, so you never download twice.
You can also build from source (git clone + docker compose up -d --build), and a fully unbranded variant is published as hyprlab/zonechart-unbranded.
Configuration
| Variable | Required | Default | Purpose |
|---|---|---|---|
ADMIN_PASSWORD | Yes | — | Protects the /admin dashboard |
DEFAULT_ORIGIN | No | 439 | Origin prefix (3-digit ZIP) shown on first load |
CHARTS_DIR | No | /data/charts | Where downloaded charts are stored inside the container |
CHART_PATH | No | (bundled seed) | Fallback single chart used when CHARTS_DIR is empty |
REFRESH_STATUS_PATH | No | /data/refresh_status.json | Where refresh progress is written |
Plain HTTP on one port — any reverse proxy (Caddy, Traefik, nginx) can front it. Put it behind HTTPS if exposed beyond your LAN.
Example .env
Copy this to .env next to your docker-compose.yml and adjust:
# copy to .env and edit
ADMIN_PASSWORD=change-me
# origin prefix shown on first load (any 3-digit ZIP prefix you have a chart for)
DEFAULT_ORIGIN=439
Updating & backups
docker compose pull && docker compose up -d
Your charts and settings persist across updates. The ./data directory is the only state — back that up and you have everything. UPS refreshes rates each late December; when they do, use Admin → Force full re-download → Refresh.
AI notice
ZoneChart is built by a human maintainer working with generative AI as a development tool:
- Code — the large majority of the code in the repository was written with Anthropic's Claude (via Claude Code), working from the maintainer's direction. The maintainer decides what gets built, reviews the results, tests every release, and signs off on everything that ships.
- Text — documentation, release notes, and in-app copy are largely AI-drafted and human-edited.
- The app itself contains no AI. ZoneChart has no AI features and makes no requests to AI services — AI was used to build it, not to run it.
Bug reports and pull requests are welcome from humans and their AI tools alike; everything merged gets the same human review.
Tech stack & license
Flask + gunicorn · D3 · Playwright + Chromium on Docker — no database; the chart files are the data store. Free and open source under the GNU AGPL-3.0. Full docs and releases on GitHub, images on Docker Hub.
ZoneChart is an independent tool, not affiliated with or endorsed by UPS. Zone data is downloaded by each user from UPS's public Daily Rates pages; verify critical shipments against ups.com.